How to Read and Understand Stock Market Charts – A Beginner’s Guide, Full details 2025 updated
How to Read and Understand Stock Market Charts
If you want to succeed in stock market investing or trading, understanding stock charts is an essential skill. These charts are the language of the market, they reveal trends, momentum, and potential turning points. At first glance, they may look complicated, but once you understand the basics, reading them becomes second nature.
Table of Contents
In this guide, we’ll break down how to read stock market charts step-by-step so you can make better investment decisions.
1. What is a Stock Market Chart?
A stock market chart is a visual representation of a stock’s price movement over a specific period. It shows you:
- Price: How much the stock is worth at different times.
- Volume: The number of shares traded.
- Time frame: Can be intraday (minutes), daily, weekly, or monthly.
The most common types of stock charts include:
- Line Charts: Simple representation of closing prices over time.
- Bar Charts: Show opening price, highest price, lowest price, and closing price.
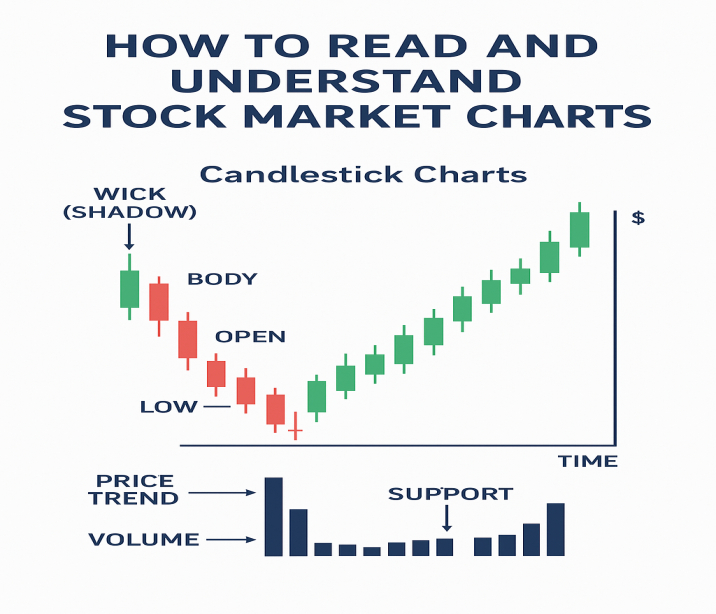
- Candlestick Charts: Popular among traders; they visually display price movements and patterns.
2. Understanding the Basic Components
a) Price Axis and Time Axis
- Horizontal Axis (X-Axis): Represents time.
- Vertical Axis (Y-Axis): Represents stock price.
b) Candlestick Basics
A candlestick has:
- Body: Difference between the opening and closing price.
- Wick (Shadow): The highest and lowest prices during the time frame.
- Color: Green/white means price went up; red/black means it went down.
3. Reading Price Trends
Trends are the backbone of chart analysis:
- Uptrend: Series of higher highs and higher lows – bullish signal.
- Downtrend: Series of lower highs and lower lows – bearish signal.
- Sideways Trend: Prices move within a range without a clear direction.
4. Key Indicators on Stock Charts
Indicators help you understand market behavior beyond just price movement:
- Moving Averages (MA): It help filter out short-term price fluctuations, making it easier to spot the overall direction or trend of a stock’s movement.
- Relative Strength Index (RSI): Measures if a stock is overbought or oversold.
- MACD (Moving Average Convergence Divergence): It is a momentum indicator that reveals both the strength and direction of a trend, helping traders identify potential buy or sell opportunities.
5. Volume Analysis
Volume represents how many shares were traded.
- High volume + Price Increase: Strong buying interest.
- High volume + Price Drop: Strong selling pressure.
- Low volume: Weak market interest.
6. Common Chart Patterns
Recognizing patterns can help you predict future price movements:
- Head and Shoulders: Signals a possible trend reversal.
- Double Top/Bottom: Indicates a reversal after testing support or resistance.
- Triangles (Ascending/Descending/Symmetrical): Show consolidation before a breakout.
7. Support and Resistance Levels
- Support: A price level where buying interest is strong enough to prevent further decline.
- Resistance: A price level where selling pressure prevents further rise.
8. Avoiding Common Mistakes
- Don’t rely only on one chart pattern or indicator.
- Avoid making decisions without considering the broader market context.
- Always combine technical analysis with fundamental research.
Conclusion
Reading and Understanding stock market charts is similar to learning a new language, with consistent practice, you’ll quickly become fluent in interpreting market movements and trends. Start with the basics: understand candlesticks, trends, volume, and key patterns. Over time, you’ll develop the skill to make informed investment or trading decisions based on what the charts are telling you.

